Analyzer
The Analyzer is the central place to inspect the results of a finished simulation. It combines a 2D playback of the traffic, an analysis map with edge-level metrics, trip statistics, and tabular access to all trips and edges in a single view.
Open the Analyzer
Click the analyzer icon in the sidebar to open a table with all successful simulations in the current workspace. Select the simulation you want to inspect and click Analyze to open it.
A simulation can consist of multiple runs, for example one run per random seed. If more than one run is available, a toolbar at the top right of the analyzer lets you switch between runs with the previous and next arrow buttons.
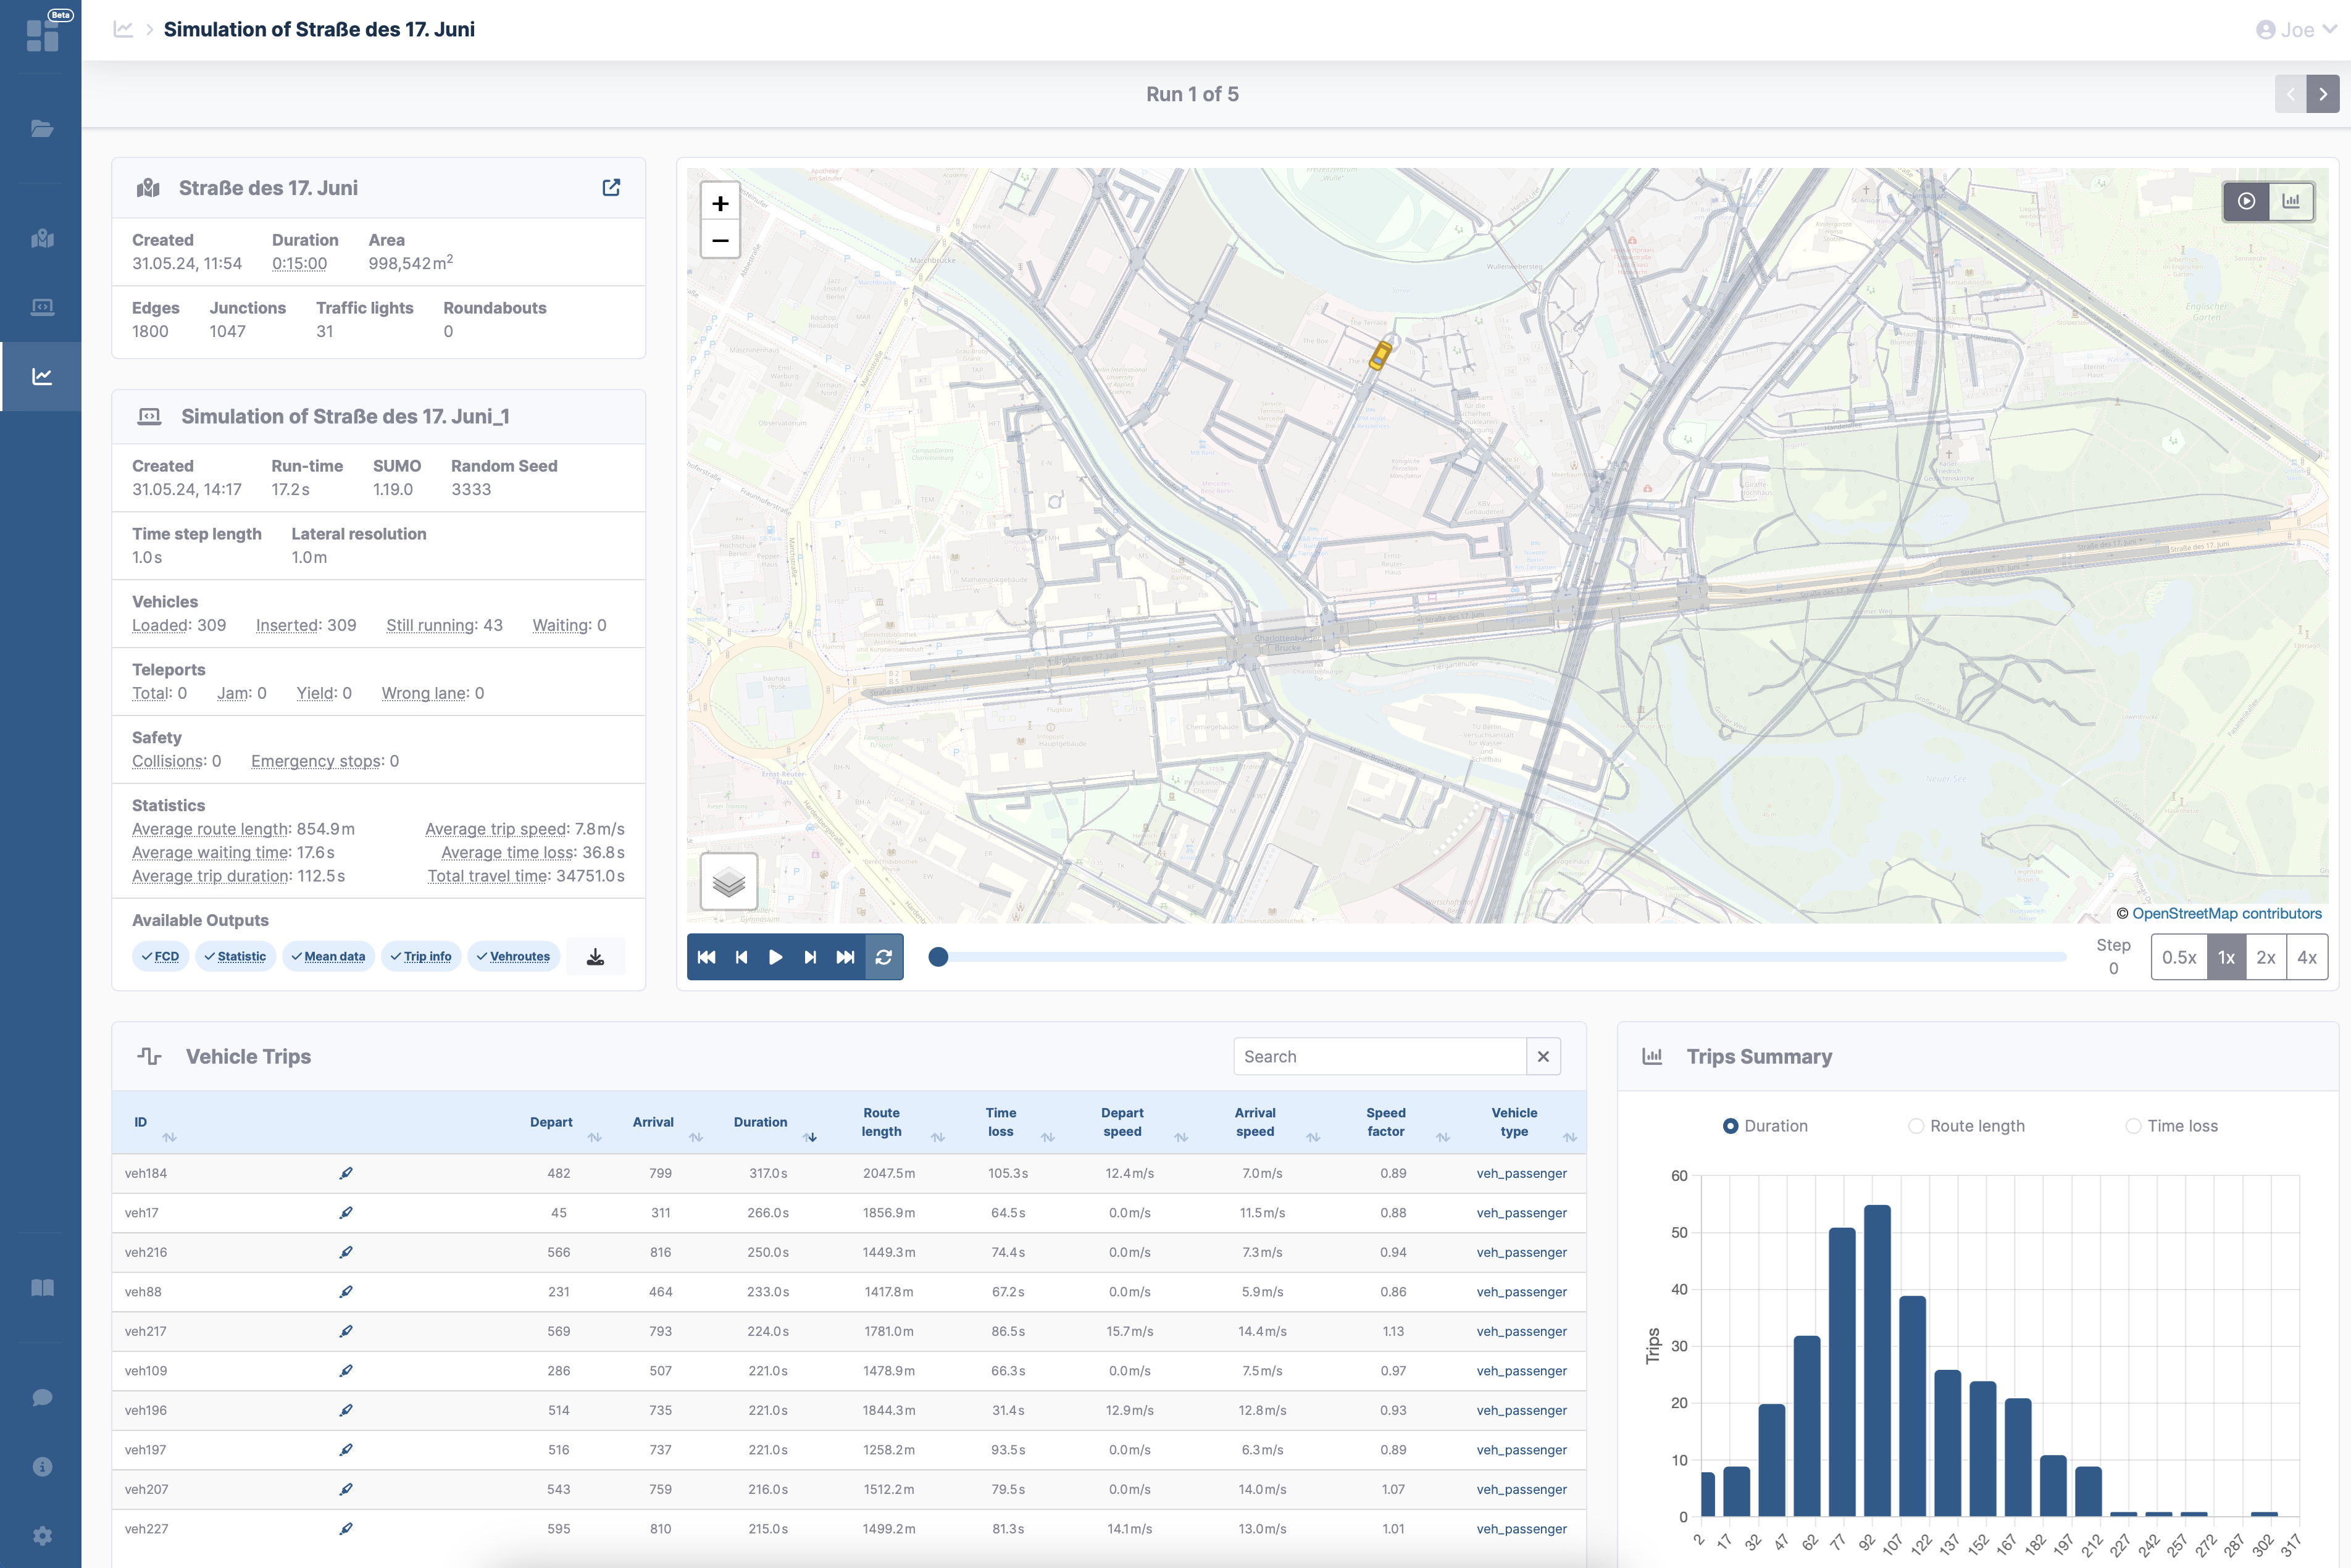
The analyzer is split into two areas:
- A left sidebar with read-only property panels for the scenario and the selected simulation run.
- A main area with two map tabs (Simulation and Analysis) and three data tabs below the map (Trip Statistics, Trips Data, Edge Data).
Scenario Properties
The scenario properties panel summarizes the scenario that was used for the simulation.
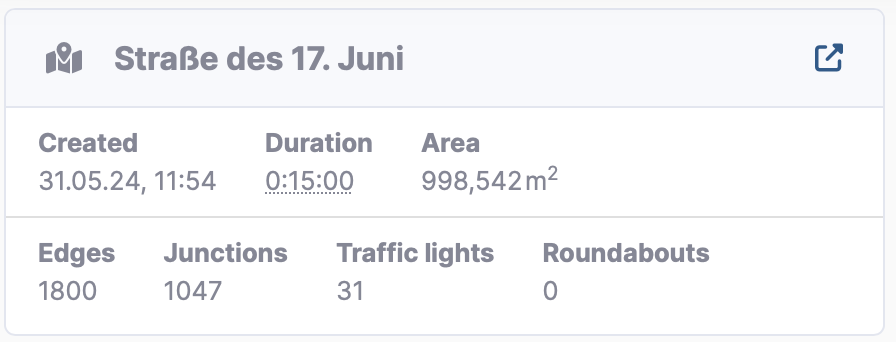
Shown values include the scenario name, creation date, simulated duration, area size, scenario version, and counts for edges, junctions, traffic lights, and roundabouts. For built-in scenarios the contributor and an optional scenario comment are also displayed. The header contains a link icon that opens the scenario in the builder for reference.
Simulation Run Properties
The simulation run properties panel describes the selected run in detail.
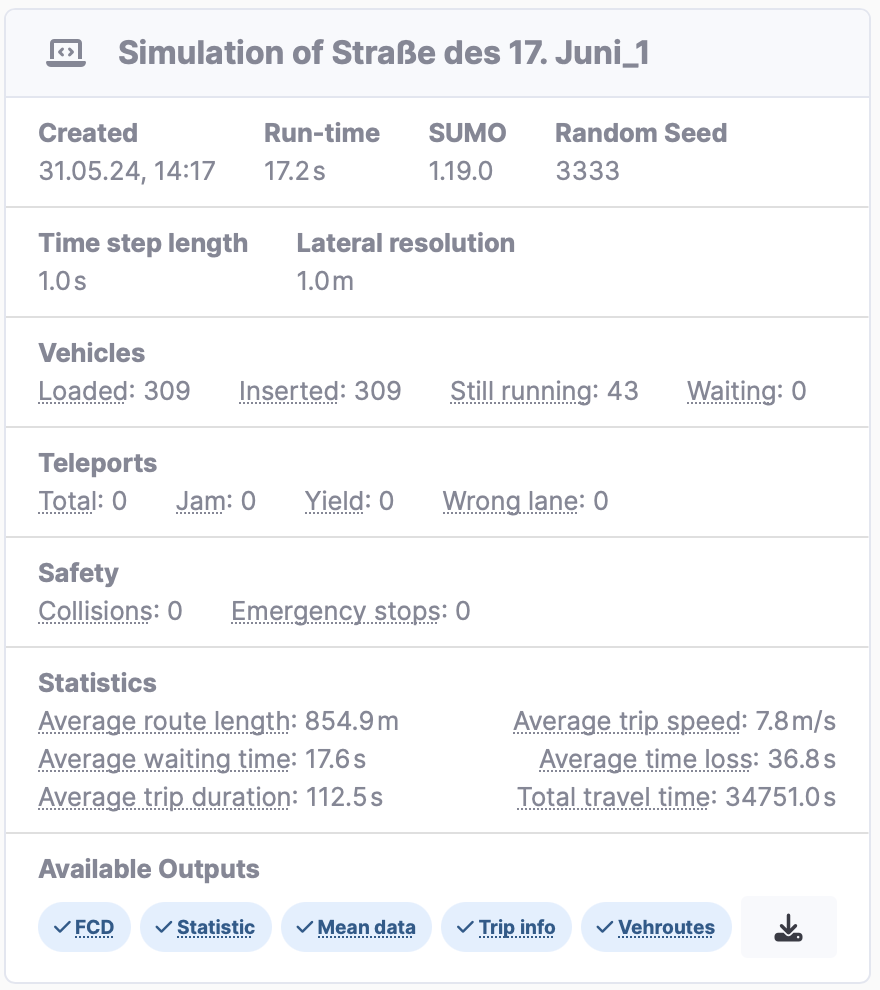
The panel is organized into several blocks:
- Basic information: SUMO version, creation timestamp, runtime duration, and the random seed used for this run.
- Execution settings: simulation step length, warm-up duration, traffic scale factor, and lateral resolution.
- Vehicles: number of loaded, inserted, running, and waiting vehicles.
- Teleports: total number of teleports and the breakdown by cause (jam, yield, wrong lane). High values are an indicator for problematic traffic situations.
- Safety: collision count and emergency stop count.
- Aggregate statistics: average route length, average trip speed, average waiting time, average time loss, average trip duration, and total travel time.
- Available outputs: badges showing which SUMO outputs were generated for this run, for example Floating Car Data (FCD), statistics, edge means, trips, and vehicle routes. A button next to the badges downloads all outputs of this run as a ZIP archive, if the user's plan allows downloads.
- Simulation comment: an editable comment field for notes on this specific run.
Many labels have small information markers that show a popover with a short explanation when hovered.
Simulation Map (Playback)
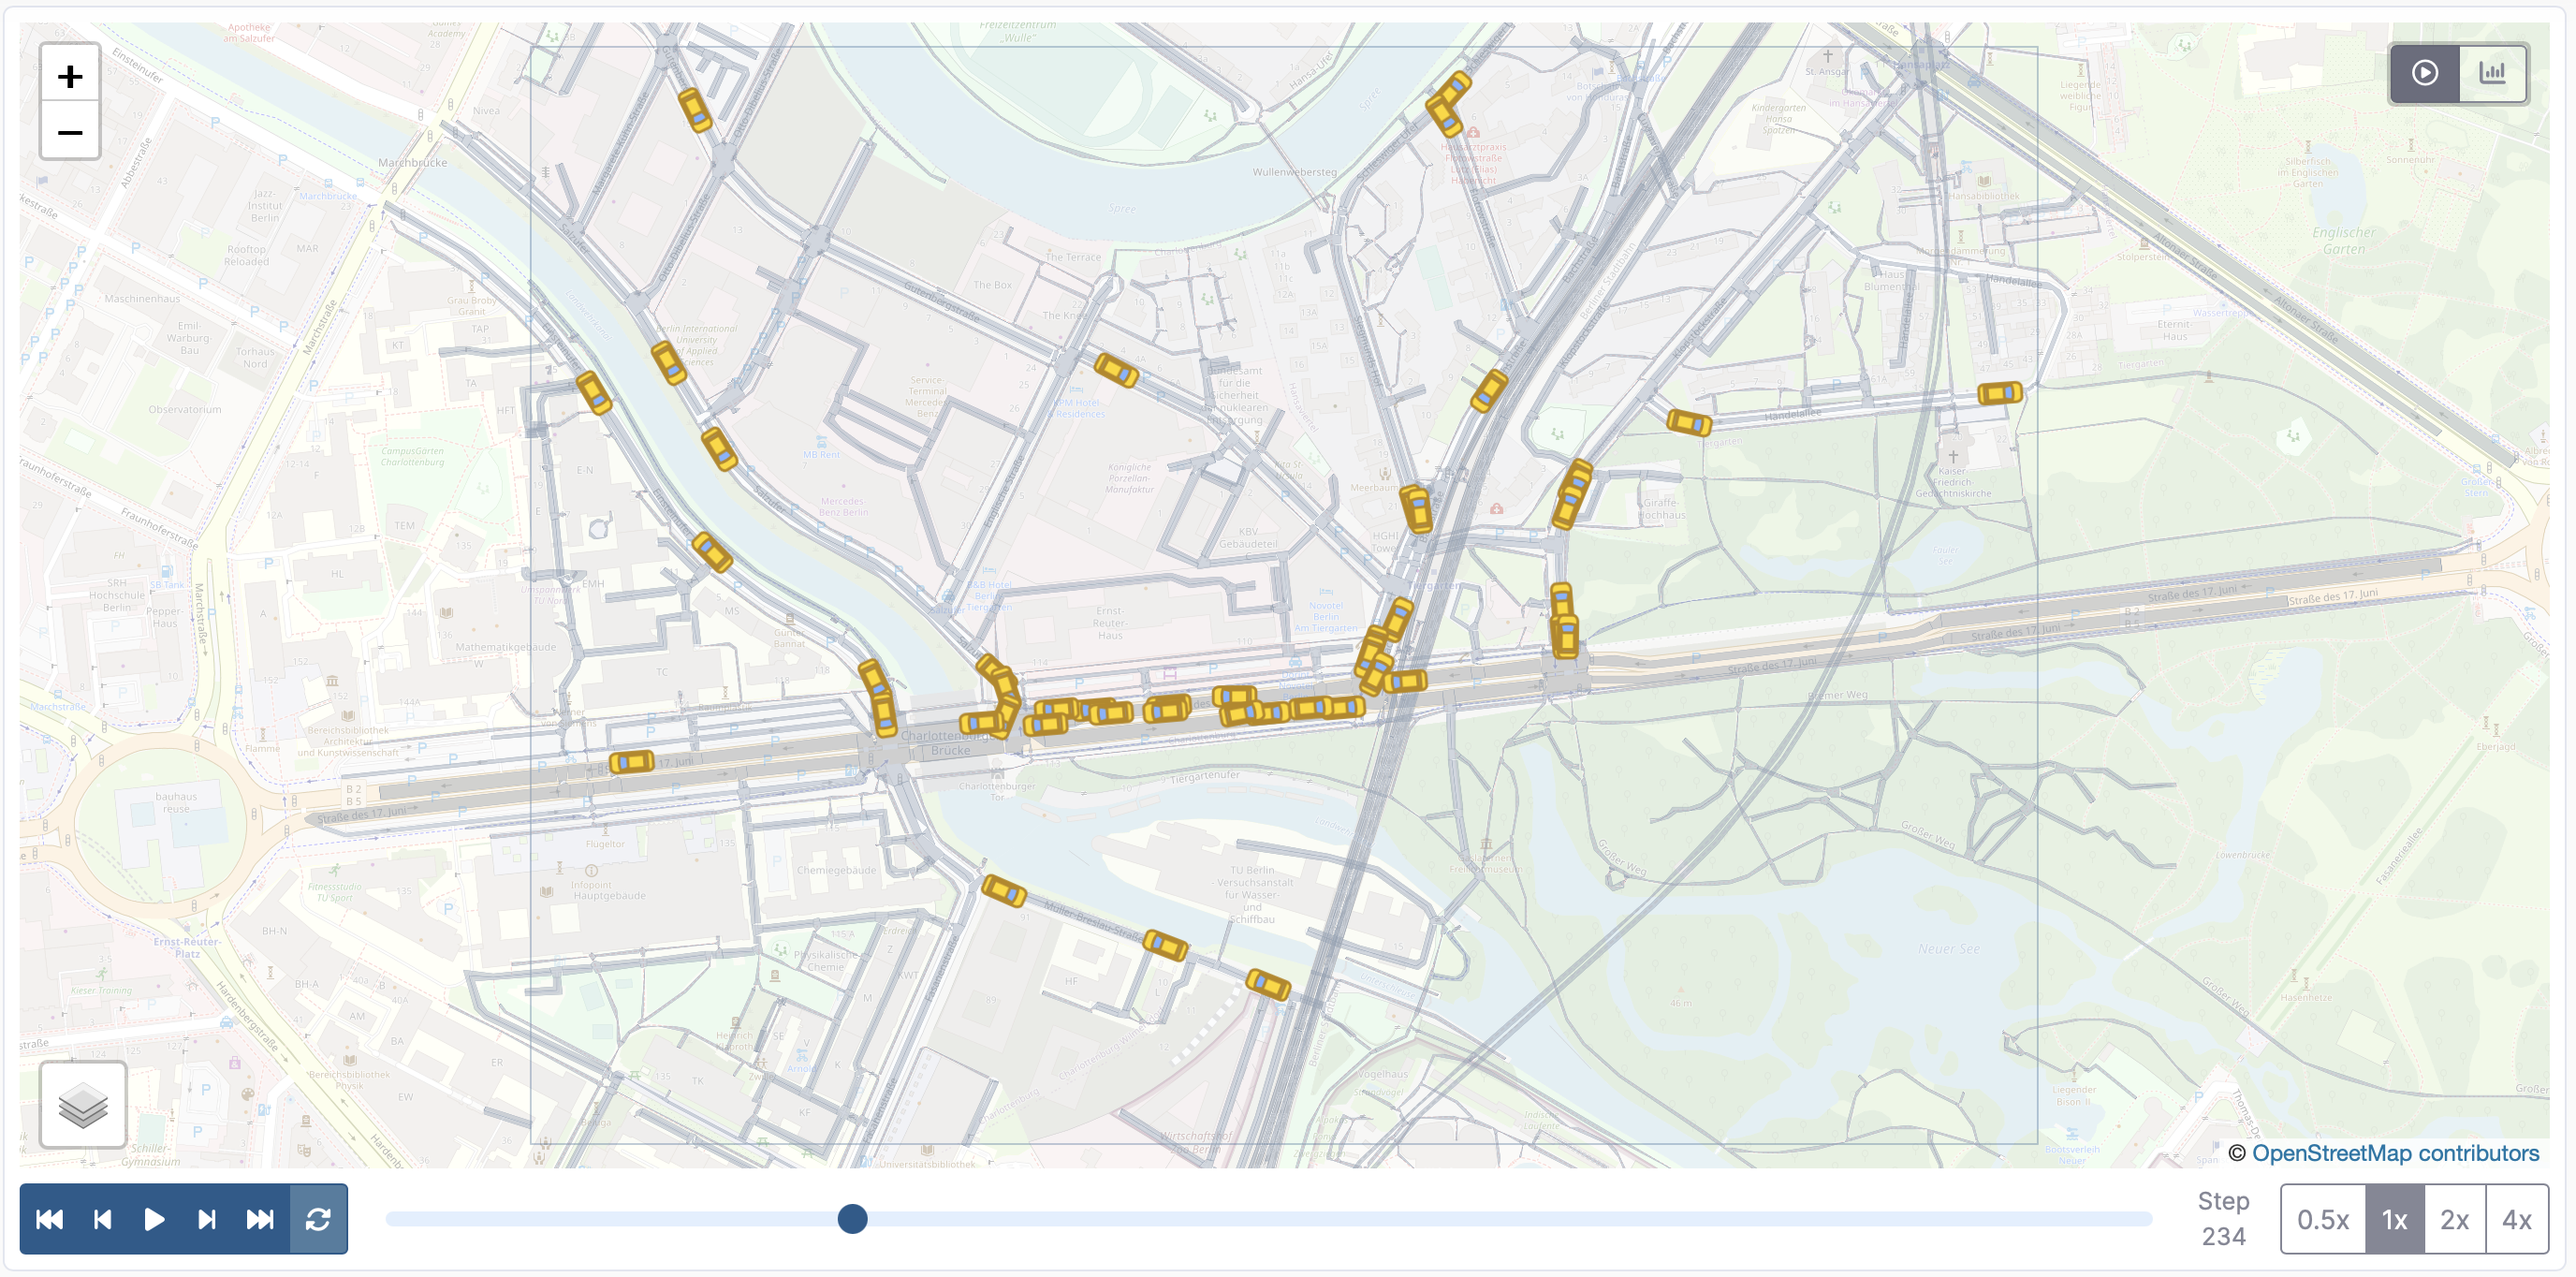
The simulation tab shows a 3D playback of the run on a MapLibre map. Vehicles and persons are rendered as 3D meshes whose shape depends on the SUMO vehicle class, so cars, buses, trams, bikes, and pedestrians are visually distinguishable.
Playback Controls
The playback bar at the bottom of the map provides:
- Play / Pause, Step backward / forward, and Jump to start / end buttons.
- A seek slider mapped to the simulation step index.
- A time display that can be toggled between human-readable simulation time (HH:MM:SS) and absolute seconds.
- A speed selector with predefined playback speeds (0.5x, 1x, 2x, 4x, 8x, 16x, and Max).
- A loop toggle that automatically restarts playback when the end of the run is reached.
Map Controls
Map controls on the left side of the map offer zoom, recentering on the scenario, and a lookup search to jump to a specific edge or junction by ID. A settings control toggles the visibility of vehicles and persons and switches between zoom-scaled and constant on-screen vehicle size.
Info Panel and Selection
Hovering over a feature highlights it with a yellow outline; clicking selects it and opens the info panel on the right side of the map.
The info panel adapts to the selected feature:
- Vehicle or person: entity ID, type (vehicle or person), live position with a Show on Map button, vehicle type and vehicle class, current speed and acceleration, current lane, the associated trip with depart and arrival time, and the planned route as a list of edges. A Follow button locks the camera onto the selected entity during playback.
- Lane: lane ID, parent edge and street name, allowed vehicle classes, lane status (open or closed), the lane's own speed limit, and lane width. Because the simulation map renders individual lanes, the speed limit is the single value of the selected lane, not a list.
- Junction: junction ID, type, and position.
Clicking the vehicle type name opens a modal with the full vehicle type properties (acceleration, deceleration, dimensions, max speed, min gap, tau, vehicle class).
Traffic light states at controlled junctions update live during playback.
Analysis Map (Statistics)
The analysis tab uses the same network rendering as the simulation tab but does not animate traffic. Instead, edges are colored by a selectable metric and the analysis info panel shows aggregate metrics for individual edges and junctions.
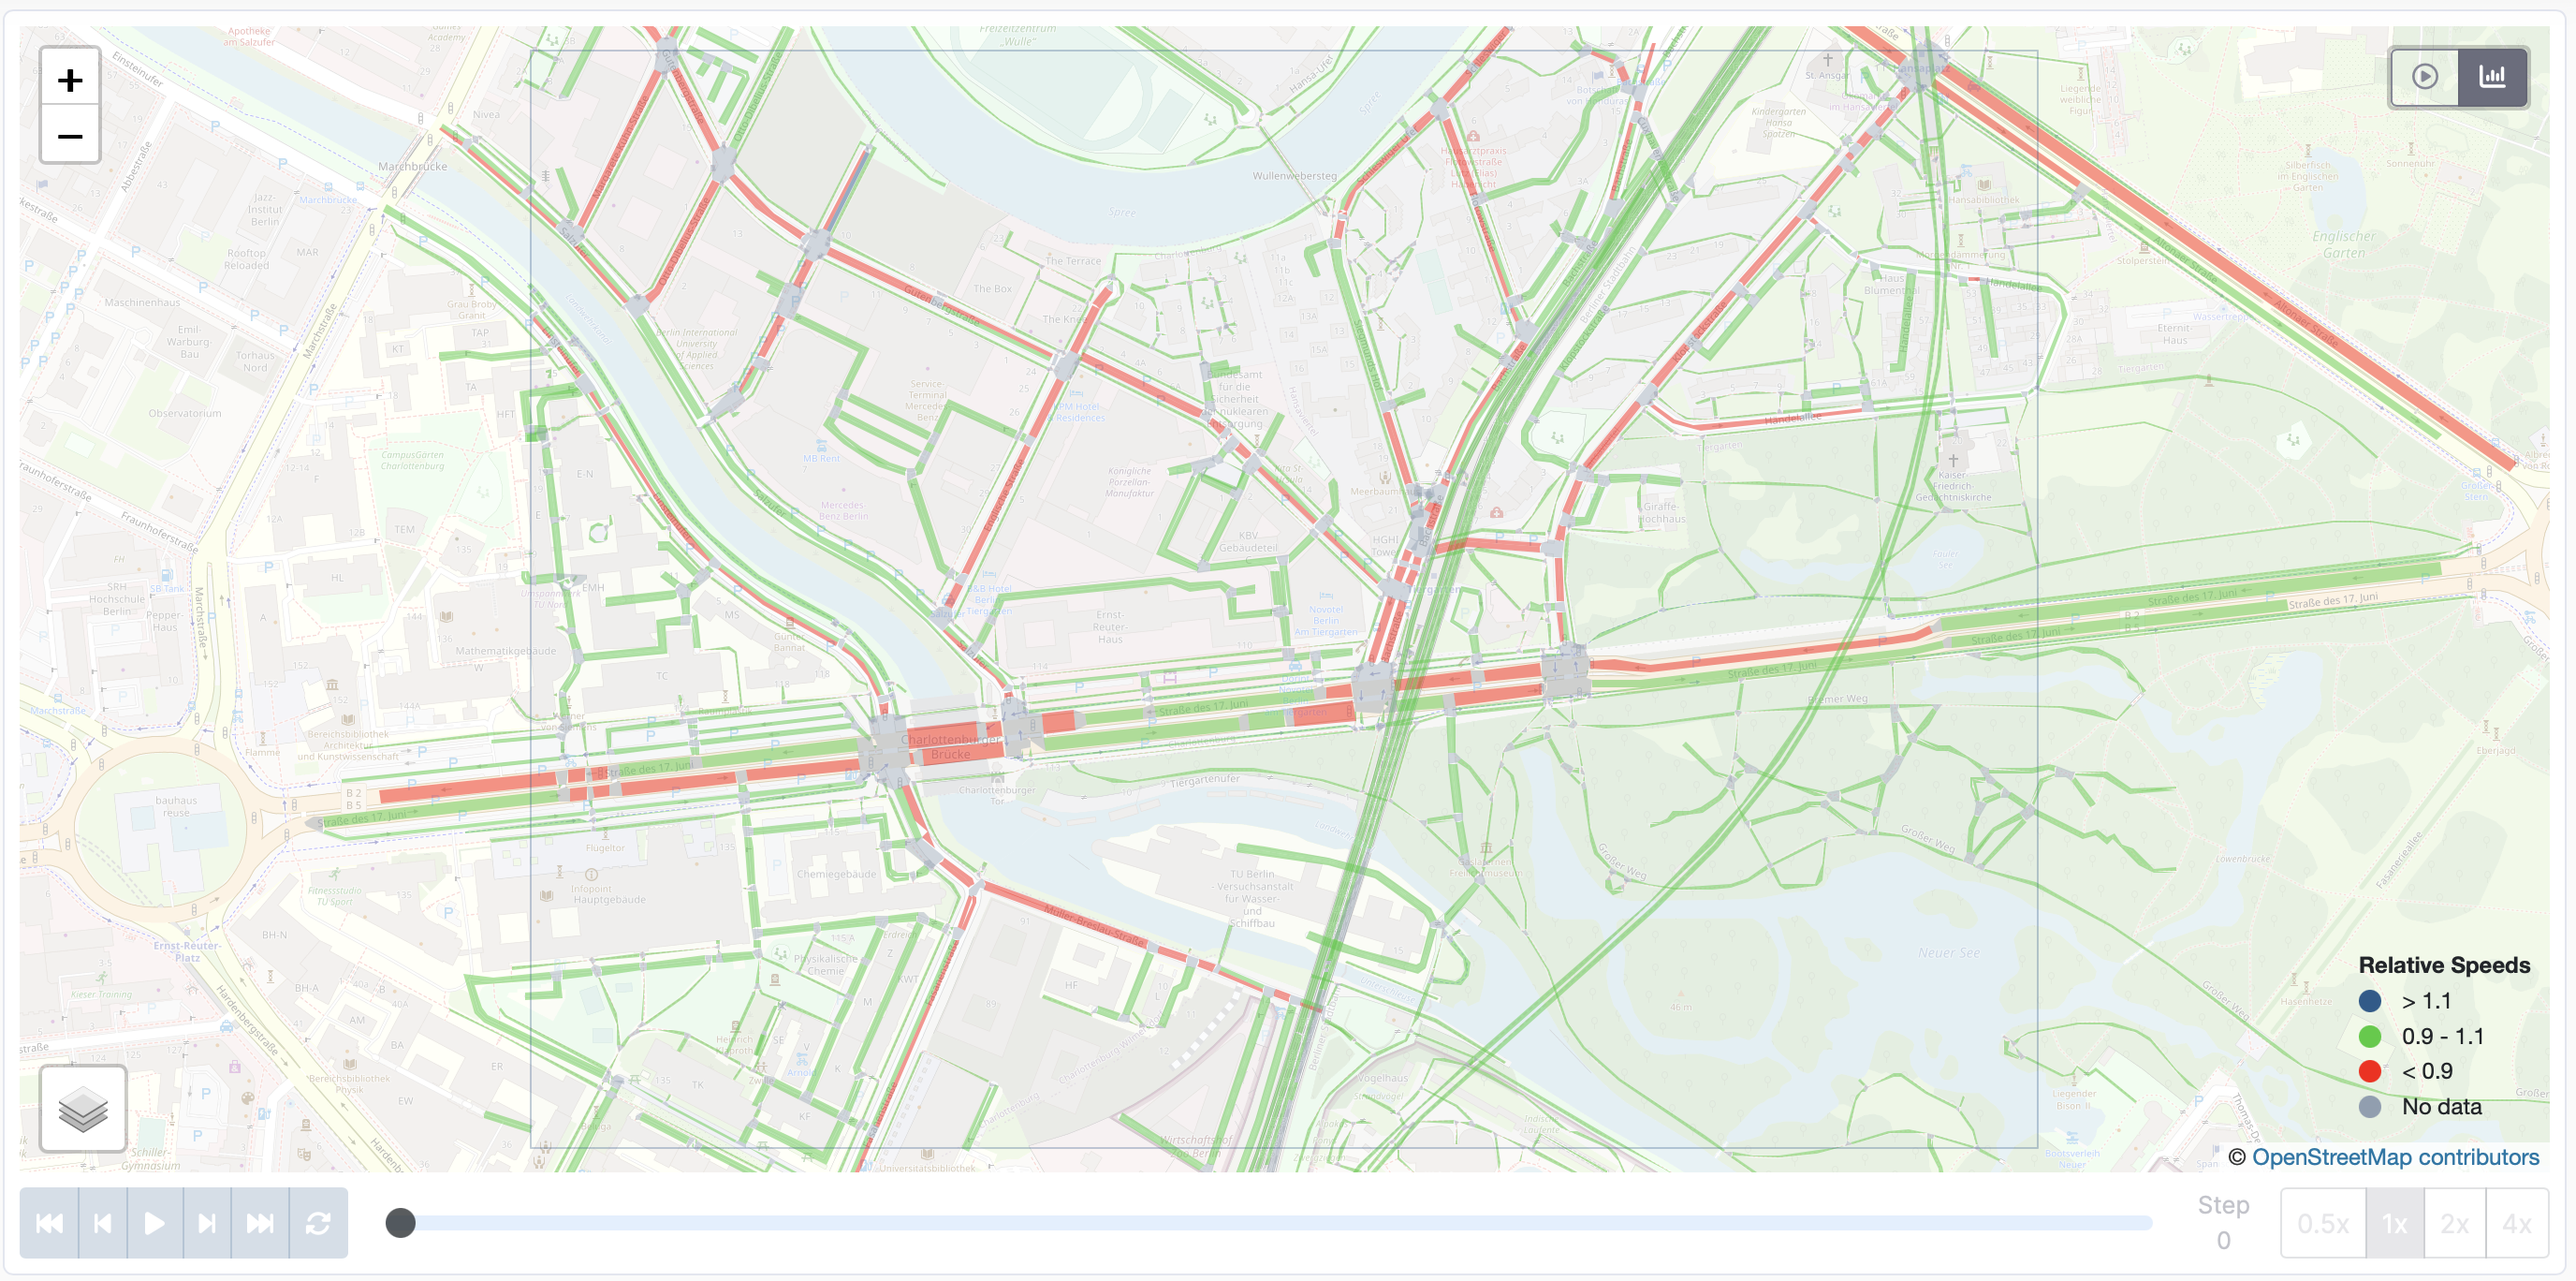
A metric selector and a color legend on the map let you switch between several edge-level visualizations, including:
- Vehicle counts entering an edge.
- Density as vehicles per kilometer.
- Time loss in seconds.
- Speed and relative speed compared to the edge speed limit.
- Flow as vehicles per hour.
The legend always shows the active metric and the corresponding color scale. Very short edges are excluded from density and flow calculations to keep these metrics meaningful.
Hovering and clicking work the same way as in the simulation tab.
Selecting an edge displays the full set of metrics for that edge in the info panel, including travel time, density, occupancy, time loss, speed, relative speed, vehicles entered, and flow.
Because the analysis tab renders edges, the edge's speed limit is shown — as in the Edge Data table — as a descending km/h list of the distinct lane speed limits (for example 100 km/h, 80 km/h), collapsing to a single value when all lanes share the same limit.
Trip Statistics Chart
The first tab below the map shows a histogram of trip metrics across all completed trips in the run.
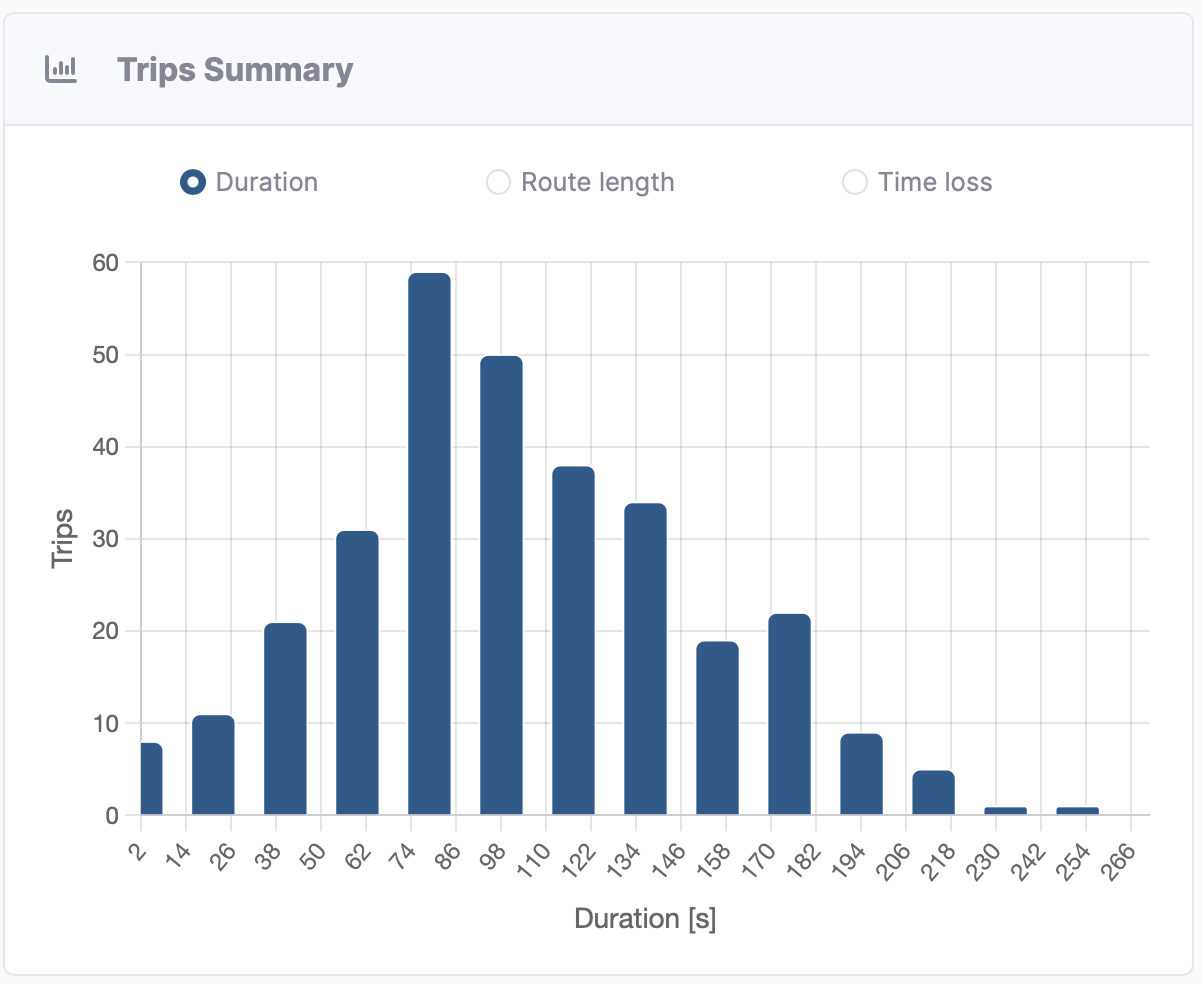
You can pick one metric to display at a time:
- Trip duration (seconds)
- Route length (meters)
- Time loss (seconds)
- Waiting time (seconds)
A filter selector lets you restrict the histogram to a specific group:
- All trips
- Only vehicle trips or only person trips
- Trips of a specific vehicle class (passenger, truck, bus, bicycle, pedestrian, and so on, depending on what is present in the run)
The histograms are computed from completed trips only. Vehicles or persons that were still in transit when the simulation ended are not included in the histograms.
Trips Data Table
The trips tab lists every trip of the run with its full set of metrics.
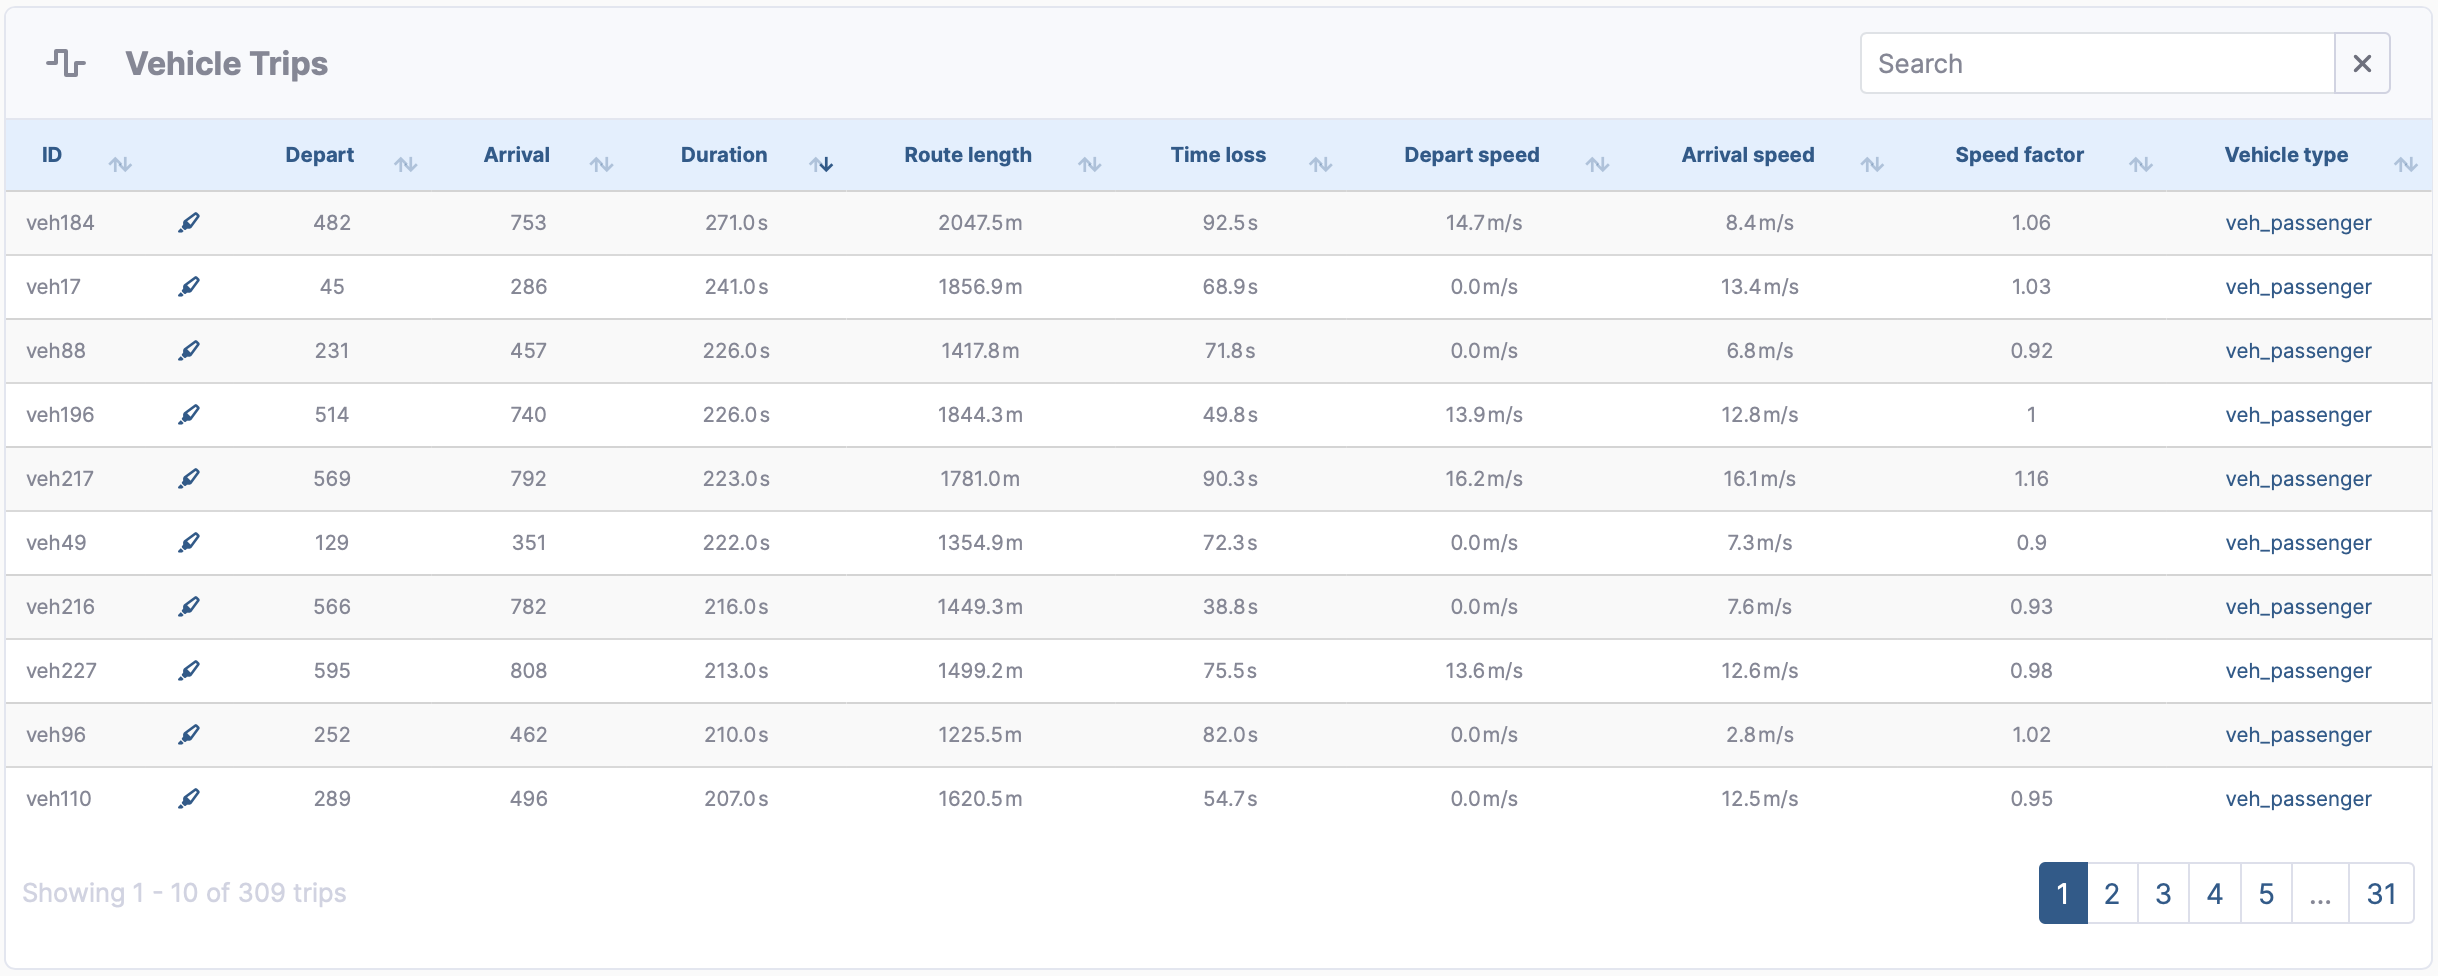
Columns include the trip ID, the trip kind (vehicle or person), departure and arrival time, duration, route length, time loss, waiting time, departure and arrival speed, speed factor, and the vehicle class and vehicle type.
The table supports:
- Free-text search across all visible columns, plus an exact-id syntax (
id=<value>) for jumping to a single trip. - Sorting by any column.
- Pagination with a configurable page size.
- Responsive columns that adjust visibility on smaller screens.
For each trip, a route button highlights the edges the trip uses on whichever map tab is currently active. Clicking the vehicle type opens the vehicle type details modal.
Uncompleted trips are also included in the table. For those entries the arrival time is empty and the trip-level metrics are the partial values accumulated up to the simulation cutoff.
Edge Data Table
The edges tab lists every edge of the scenario together with its aggregate result metrics.
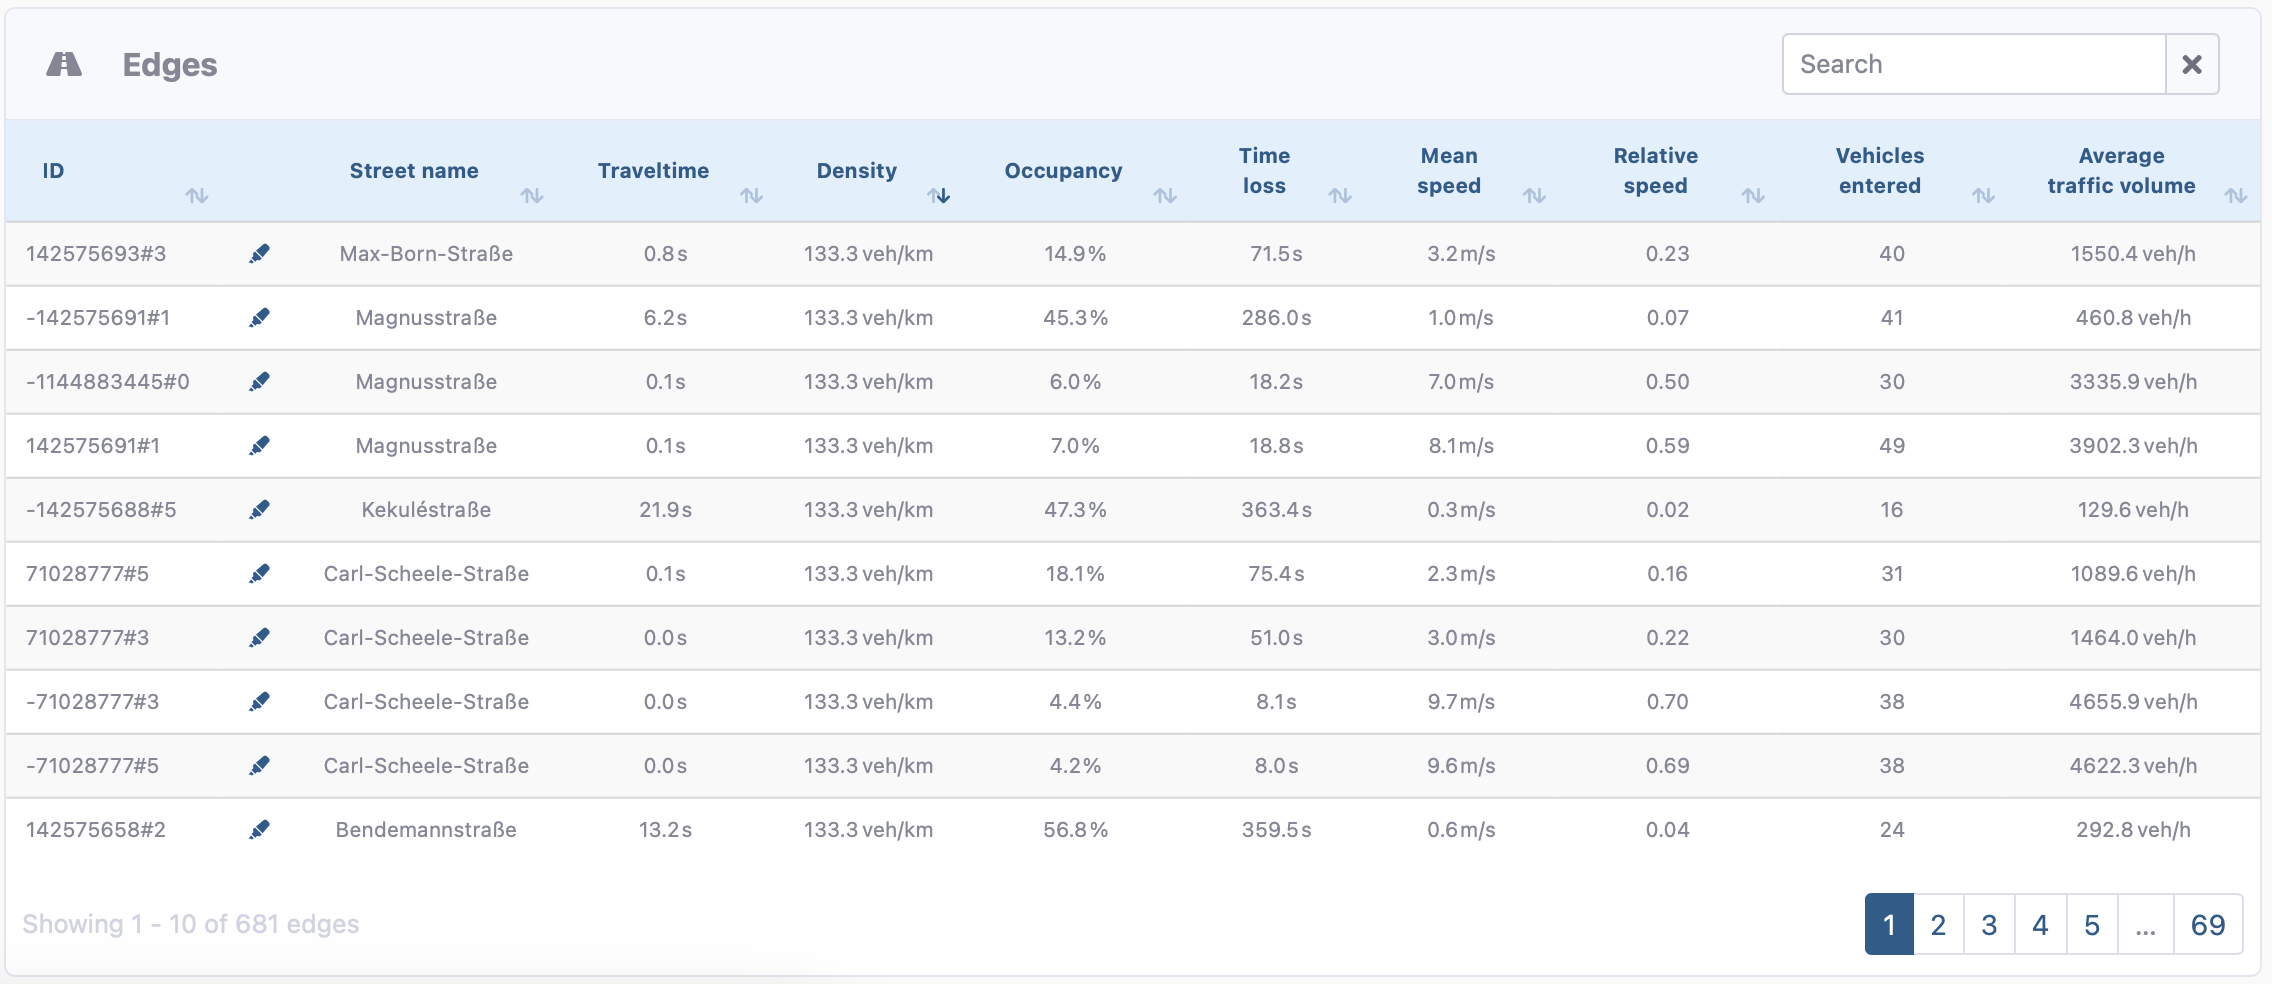
Columns include the edge ID, street name, lane count, speed limit, travel time, density, occupancy, time loss, average vehicle speed, average vehicle relative speed, vehicles entered, and flow.
The speed limit column shows the distinct speed limits of the edge's lanes as a descending km/h list (for example 100 km/h, 80 km/h); when all lanes share the same limit a single value is shown.
The table supports the same search, sort, and pagination features as the trips table. A locate button on each row highlights the edge on the active map and centers the view on it, which makes it easy to investigate edges that stand out in a column sort or search.
Downloading Results
The simulation run properties panel contains a button to download all outputs of the current run as a ZIP archive. The archive contains the SUMO output files that were enabled when the simulation was started, for example tripinfo, FCD, mean edge data, vehicle routes, and statistics. The button is disabled for plans that do not include result downloads.
For programmatic access to the same data, see the Analyzer API.